Physical Address
304 North Cardinal St.
Dorchester Center, MA 02124
Physical Address
304 North Cardinal St.
Dorchester Center, MA 02124
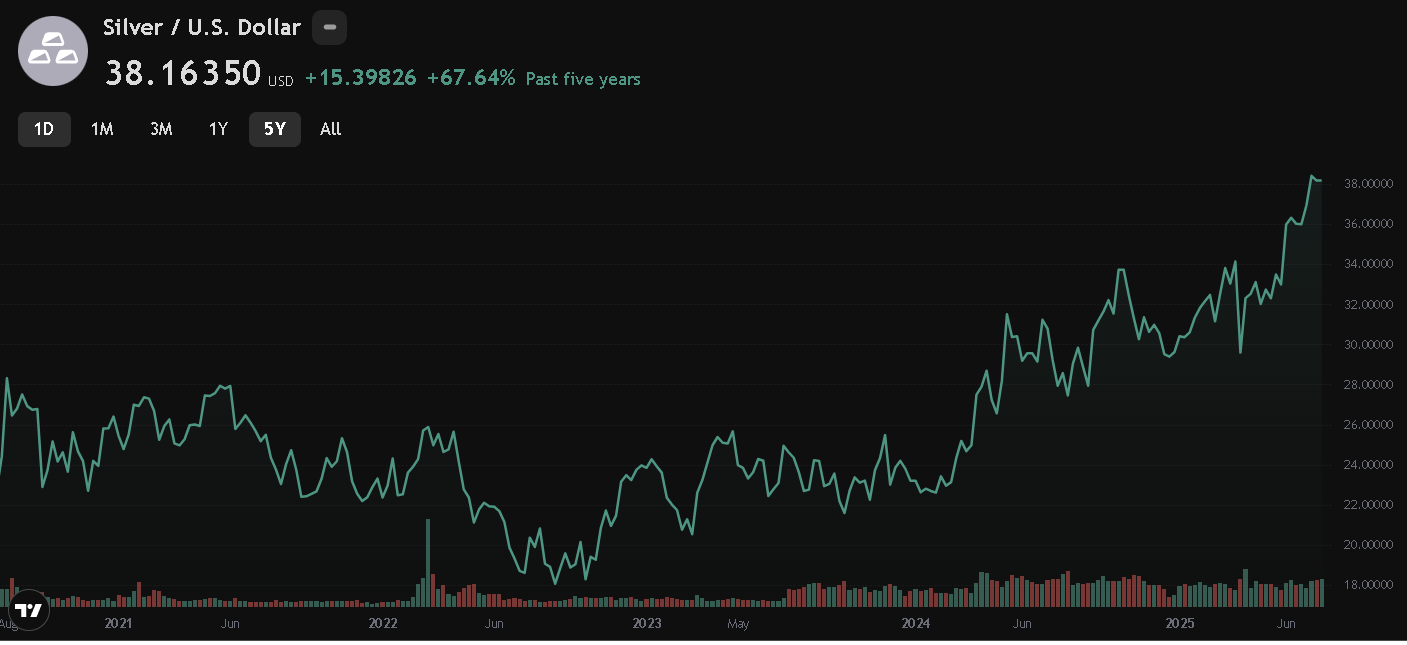
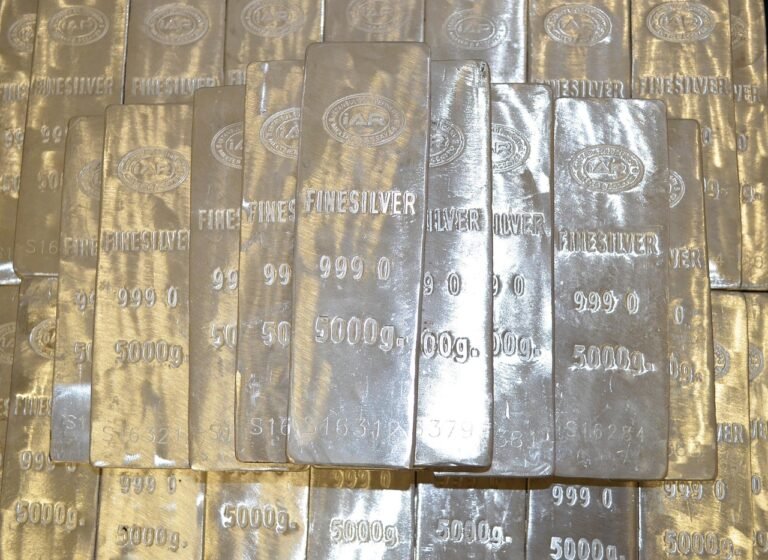
Silver was $18 in August, 2022. Presently, we are looking at nearly $40. With a 100% rise in 3 years, one would think production would be ramping up to meet the growing silver supply shortage. In this report we’ll be looking into the factors that are keeping silver production at roughly the same levels they’ve been at for the last 15 years, peaking in 2016 at 871 million ounces. (per U.S. Geological Survey)
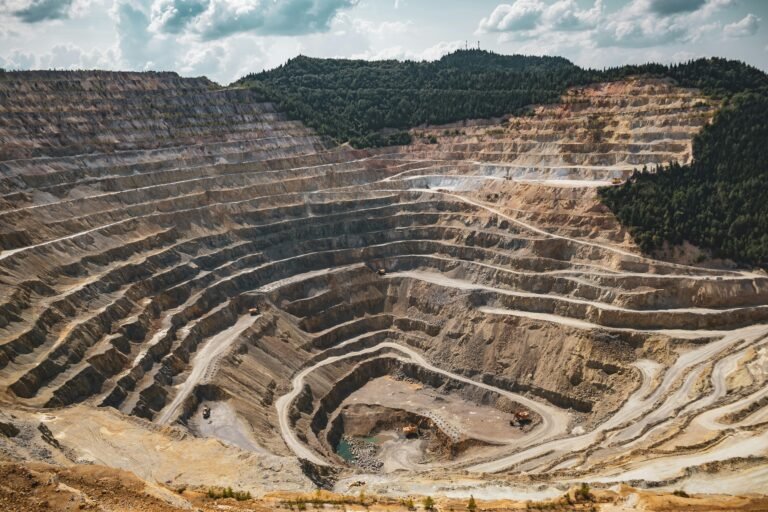
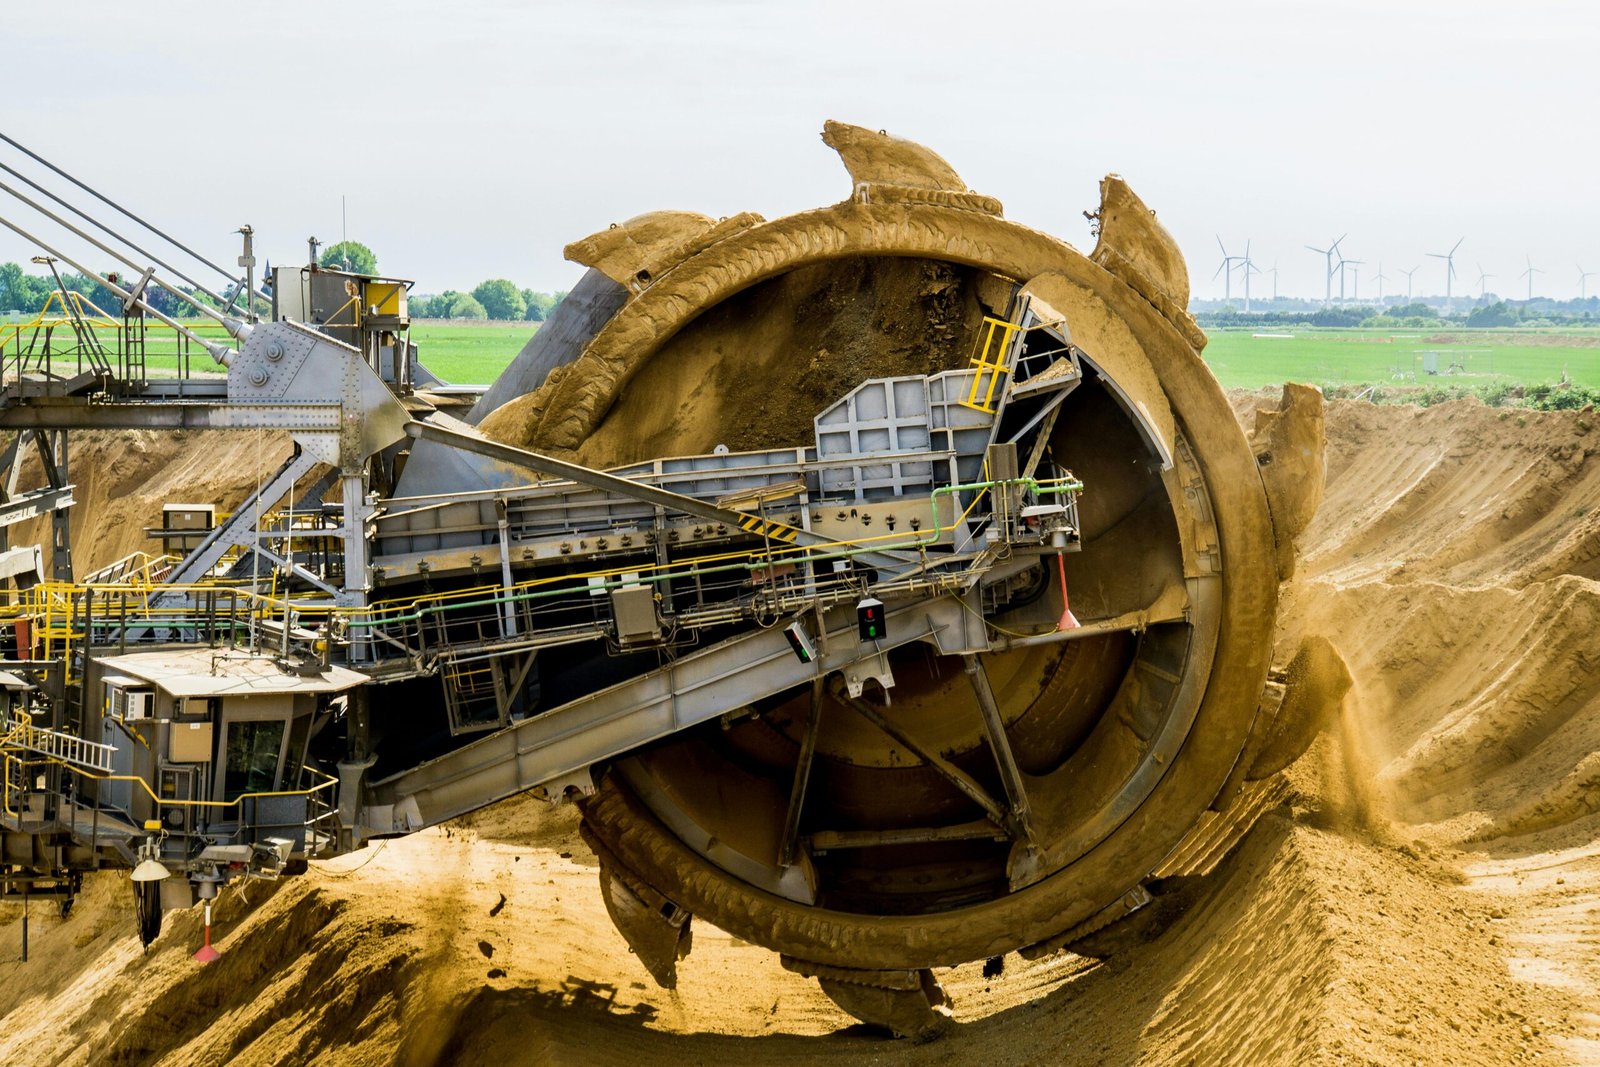
Exploration involves geological mapping, geophysical surveys, sampling, and drilling to identify and characterize a silver deposit. This stage determines whether a deposit is economically viable. Silver is often a byproduct of other metals (e.g., lead, zinc, copper), with only 25% of global supply from primary silver mines, complicating targeted exploration.
Challenges include remote locations, environmental restrictions, and the low success rate (only 1 in 10,000 exploration projects becomes a mine). Exploration costs ($10–50 million for advanced drilling) with no guaranteed success.
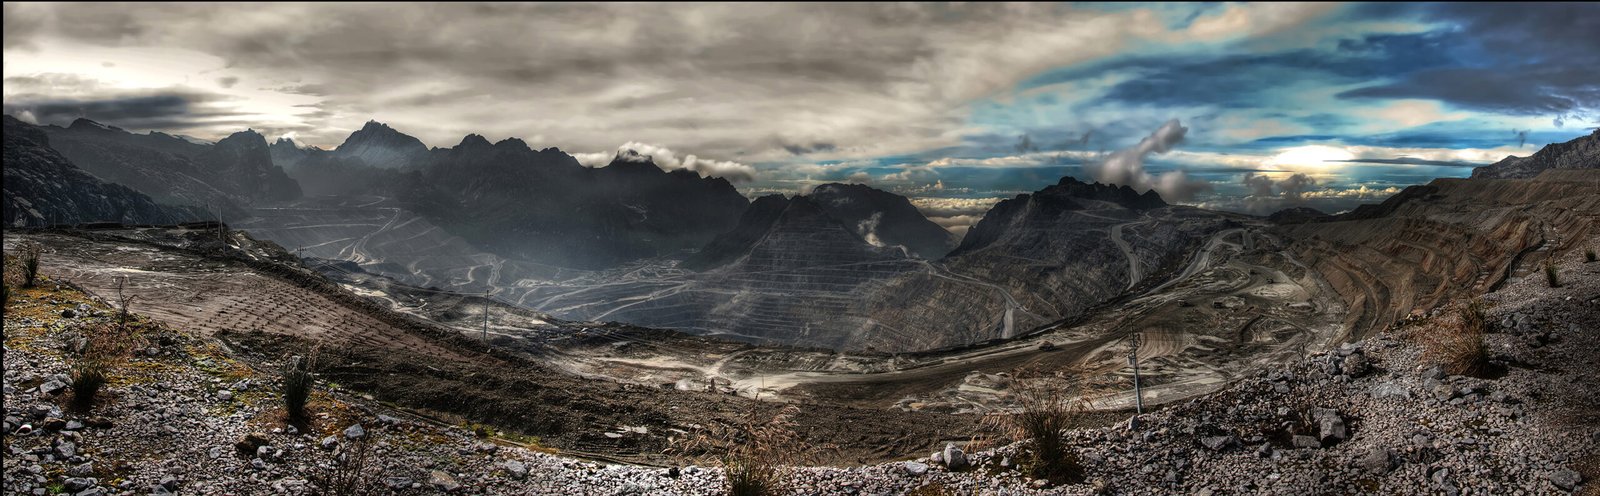
This stage involves securing permits for environmental compliance, land use, water rights, and mining operations. It requires environmental impact assessments, community consultations, and adherence to local, state, and federal regulations. In major silver-producing countries like Mexico, Peru, and the U.S., permitting is a significant bottleneck due to stringent environmental standards.
Financing involves raising capital for mine construction and operations. A feasibility study (FS) is required to demonstrate economic viability to investors. Silver projects face unique challenges due to high capital costs ($500 million–$2 billion for large mines) and market volatility, as silver prices are less predictable than gold or copper.
Construction involves building the mine infrastructure, including processing plants, roads, power facilities, and worker housing. For silver mines, construction is capital-intensive due to the need for specialized processing and environmental mitigation measures. Remote locations, common for silver deposits, require additional infrastructure like roads and power grids.
only 1 in 10,000 exploration projects becomes a mine
Terronera Project (Endeavour Silver, Mexico)
EC120 Project (Coeur Mining, Mexico)
Media Luna Project (Torex Gold, Mexico)
Tahuehueto Project (Telson Mining/Luca Mining, Mexico)
Prognoz Silver Mine (Polymetal/Solidcore Resources, Russia)
Panuco Project (Vizsla Silver, Mexico)
Silver Sand Project (New Pacific Metals, Bolivia)
Alamos Silver Project (Minaurum Gold, Mexico)
Total Projects: The above list identifies 8 specific silver-producing projects under construction or nearing construction (e.g., Panuco, Silver Sand, and Alamos are in late-stage permitting but not yet under construction).
These projects, once operational, are expected to add ~40–50 Million ounces annually by 2028, per the Silver Institute’s World Silver Survey 2025. This is significant but insufficient to close the projected 117.6 Moz deficit, as demand (1.2 Billion oz in 2025) outpaces supply growth.
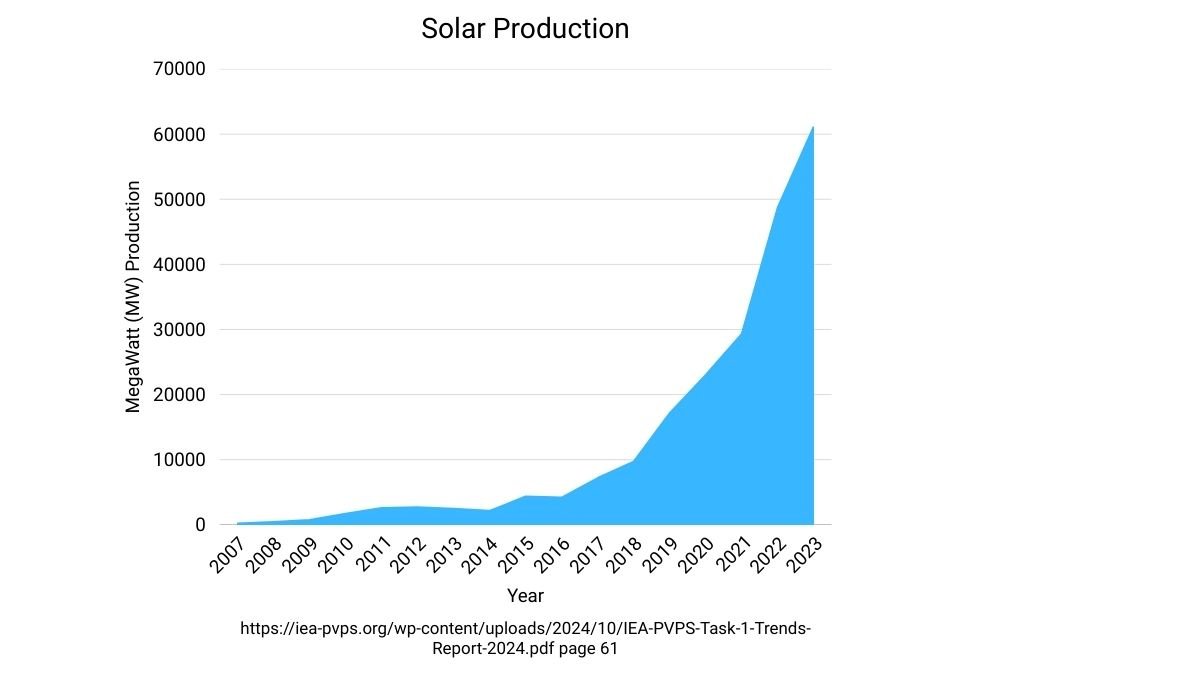
In 2023, the solar photovoltaic (PV) industry consumed 193.5 Moz of silver, representing 16–19% of total global silver demand (1,195 Moz). This marked a 64% increase from 2022’s 118.1 Moz.
The Silver Institute projects that solar panel production will consume 232 Moz in 2024, a 20% increase from 2023, accounting for approximately 19% of total silver demand (1,219.1 Moz)
2030 Estimate: Sprott.com predicts up to 273 Moz, and Long-term projections suggest solar could consume 500 Moz annually by 2050 per World Bank.
The solar industry alone could use up the additional supply by new mines and still need more silver by 2030.
For more on silver industrial uses read Why Is The World Running Out of Silver?
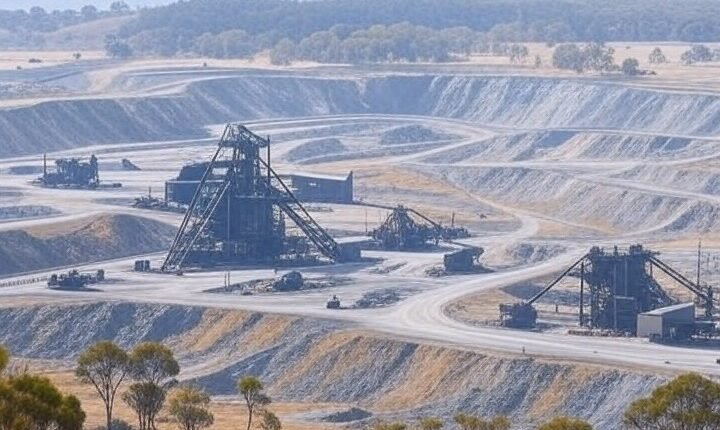
Produced 12.66 Moz in 2020, down from a peak of ~30 Moz in the early 2000s, making it one of the world’s largest silver mines.
Operational since 1997, Cannington (a lead-zinc-silver mine) was estimated in 2012 to have an 11-year mine life, suggesting reserves could be exhausted by ~2023–2025 unless new deposits are found. Declining ore grades (from 500 g/t silver in the 1990s to ~200 g/t in 2020) and rising extraction costs signal depletion.
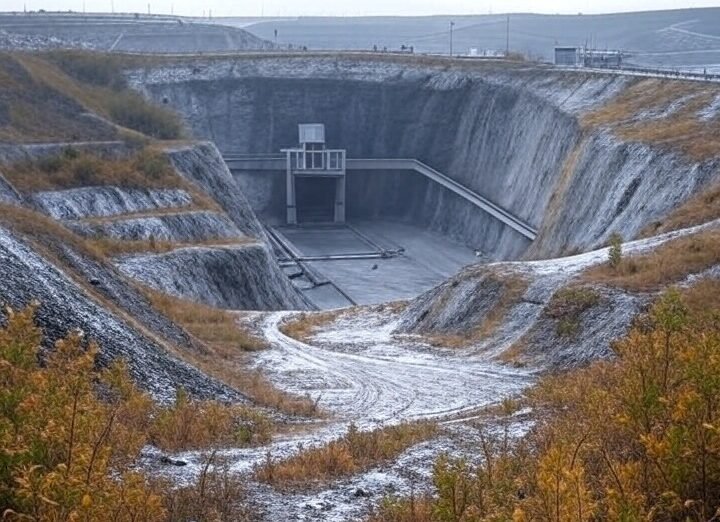
Produced 18.2 Moz in 2020, one of the largest primary silver mines globally.
Operational since 2002, Dukat has seen a decline in output due to depleting high-grade reserves and regional imbalances. Reserves are estimated to last until ~2027–2030, with lower-grade ores requiring costlier extraction. Geopolitical sanctions further complicate equipment sourcing and expansion.
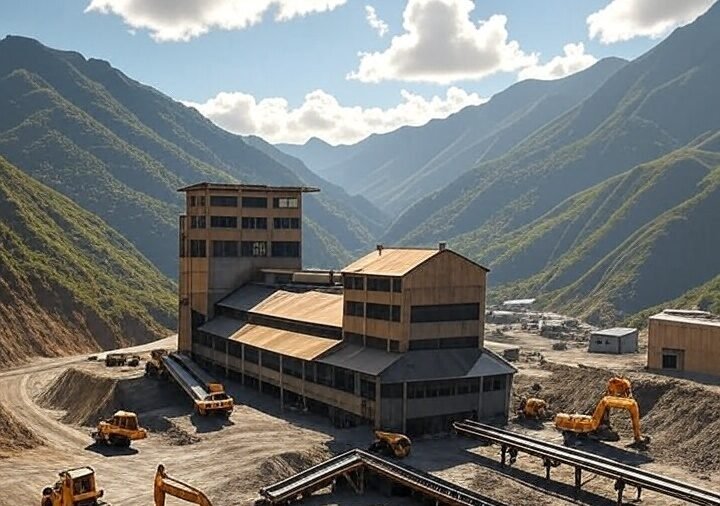
Produced 10.49 Moz in 2024, a key contributor to Peru’s 107.1 Moz.
Operating since 1975, Uchucchacua faces declining ore grades and land use disputes with local communities, reducing output. Reserves are projected to last until ~2028–2032, with deeper, lower-grade deposits increasing costs. Permitting delays (3–7 years) for expansions exacerbate supply constraints.
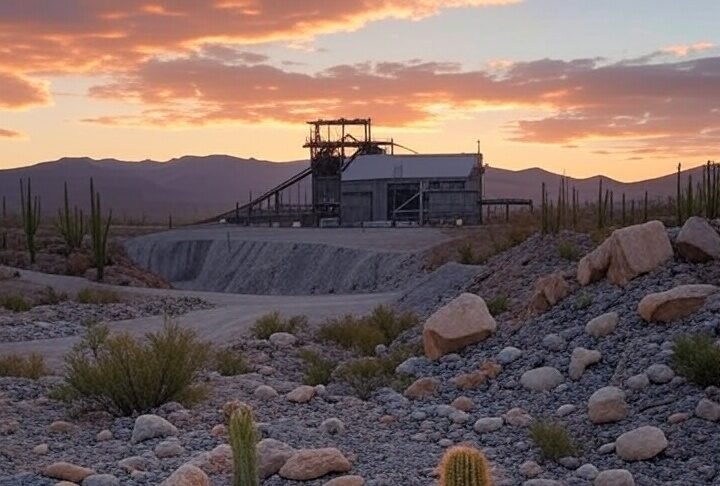
Produced 14.47 Moz in 2024, contributing 25.7% to Fresnillo’s total silver output.
Operational since 2011, Saucito is a primary silver mine with reserves estimated to last until ~2030, based on Fresnillo’s reports. Declining ore grades (from 300 g/t in 2011 to ~200 g/t in 2023) and increasing environmental compliance costs (e.g., water management) signal maturation. Regulatory hurdles in Mexico, including open-pit restrictions, limit expansion potential.
Produced 17.3 Moz in 2020, India’s largest silver mine.
Operational since 2006, Sindesar Khurd (a lead-zinc-silver mine) has reserves estimated to last until ~2030–2035, with 79 million MT of ore remaining. Declining silver grades and high extraction costs for underground mining signal maturation.
Many major mines (e.g., Cannington, Dukat, Uchucchacua) report lower silver grades (e.g., 50–60% reductions since peak production), requiring costlier extraction from deeper or lower-quality deposits.
Despite soaring silver prices and demand, particularly from solar panel production consuming 232 million ounces in 2024 and projected to reach 273 million ounces by 2030. Silver producers cannot rapidly increase supply due to the depletion of major mines and lengthy development timelines. Iconic operations like Australia’s Cannington, Russia’s Dukat, and Peru’s Uchucchacua face dwindling reserves, with lifespans ending by 2028–2035, mirroring the U.S.’s 27% production decline since 2015. With only 10–15 new mines under construction, expected to add just 40–50 million ounces annually by 2028, the 117.6 million-ounce deficit projected for 2025 will persist. The 8–28-year timeline for new mine development, compounded by regulatory, financing, and infrastructure hurdles, ensures that the silver supply shortage will continue and markets will face a structural imbalance as industrial demand, driven by green energy, outpaces the industry’s ability to replace maturing mines into the foreseeable future.
Try this article about the silver supply shortage timeline “When Will the Silver Deficit Deplete Above-Ground Stocks“
Sources