Physical Address
304 North Cardinal St.
Dorchester Center, MA 02124
Physical Address
304 North Cardinal St.
Dorchester Center, MA 02124

Silver’s price exploded from a low of around $28 in April 2025 all the way to a jaw-dropping peak of $121 in early 2026 — a ride that left longtime holders euphoric and newcomers scrambling to get in. Then came the gut-punch drop back toward $61 in March. Now prices are hovering in the $67–70 zone, and the same questions are on everyone’s mind: Was that the top of a massive bubble? Did you miss your chance to sell at the peak? Or is this the dip where smart money loads up for the next leg higher?
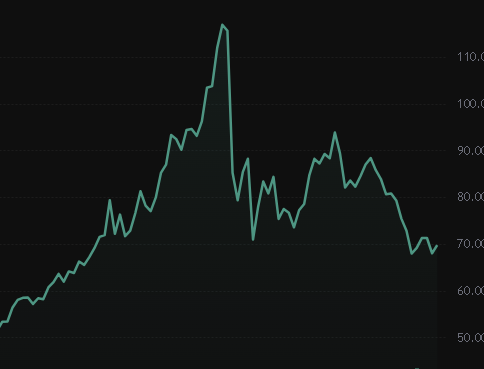
If you’re staring at your stack (or wishing you had one), you’re not alone. Almost everyone following silver cares about one thing above all: where the price is headed next. To answer that, we need to look past the Wall Street noise and zero in on the real physical silver market — the actual supply and demand for bars and ingots that factories buy and use. That’s where the Shanghai Gold Exchange’s AM and PM auctions come in. They reveal what industrial buyers are truly willing to pay for real metal right now. Understanding these physical pricing mechanics won’t just calm your nerves — it can give you a genuine edge in figuring out whether silver still has room to run or if caution is the smarter play.
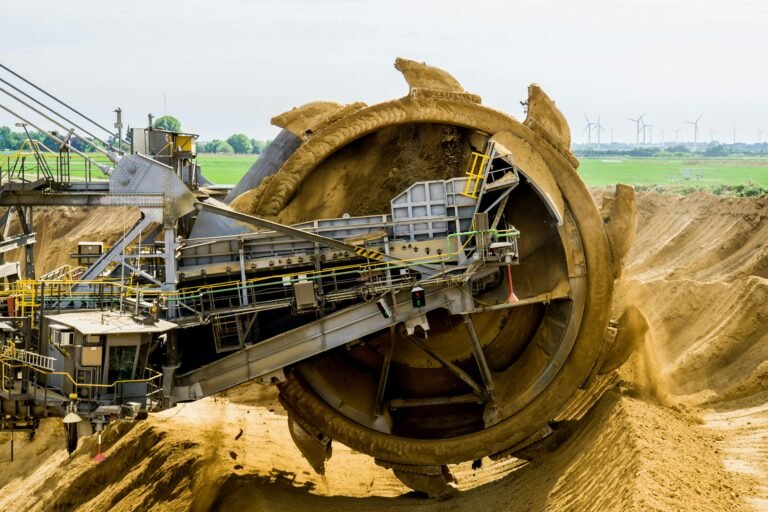
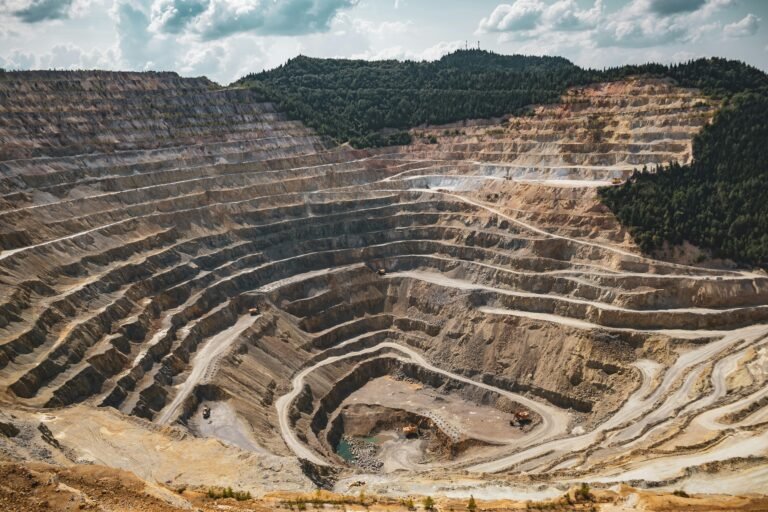
That supply has been relatively flat for over a decade. It can’t surge overnight like oil or copper.
To read more about silver’s limited supply: https://silverpundit.com/why-silver-supply-lags-behind-soaring-demand/
Here’s the big shift that’s changed everything: industrial and manufacturing demand now accounts for roughly 55–60% of all silver consumed globally. In 2024 it hit a record 680.5 million ounces — over half the world’s entire annual supply. That figure stayed near record levels into 2025. It’s silver going straight into:
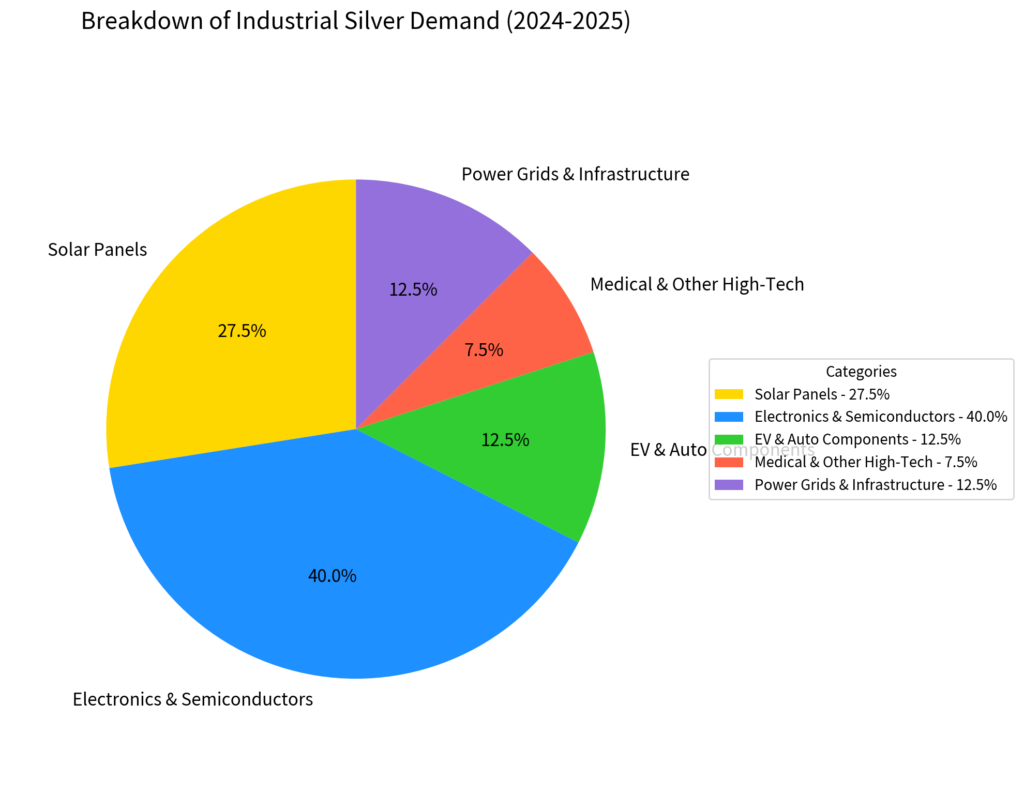
Because these sectors treat silver as a critical input (it’s the best electrical conductor on Earth), their demand is far more “sticky” than investor buying. Factories don’t stop production just because the price jumps — they keep buying physical bars and ingots as long as it makes economic sense. Jewelry, silverware, and investor coins/bars make up the rest of demand, but they swing more with price and sentiment. When silver rockets higher, those categories often pull back, while industrial buyers keep competing for real metal.
To read more about silver’s growing demand: https://silverpundit.com/why-is-the-world-running-out-of-silver/
Western benchmarks like the LBMA Silver Price (London) provide a daily reference via a single electronic auction at 12:00 London time. It’s for unallocated loco-London silver and serves as a global spot benchmark, but it does not require immediate physical delivery.
In contrast, Asia—especially China, the world’s largest industrial silver consumer—uses mechanisms that prioritize physical settlement. The standout is the SGE’s Shanghai Silver Benchmark Price (SHAG). This is the price industrial manufacturers in China (and increasingly influencing global physical flows) actually pay for large refined ingots.
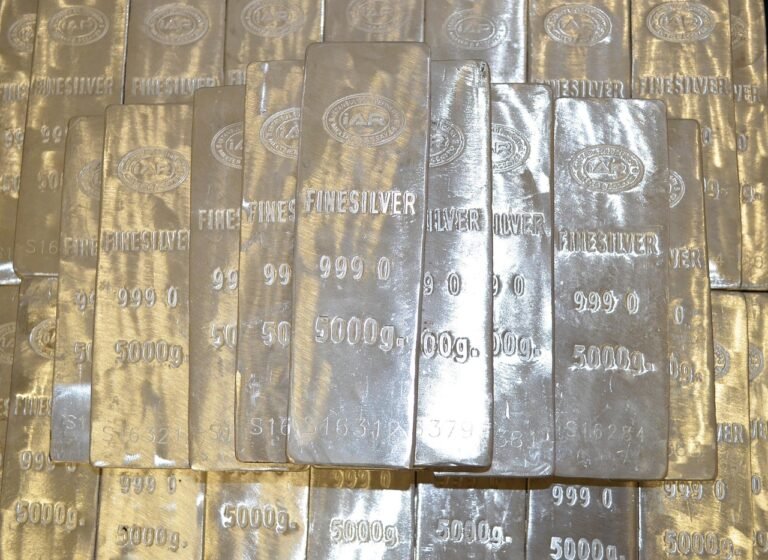
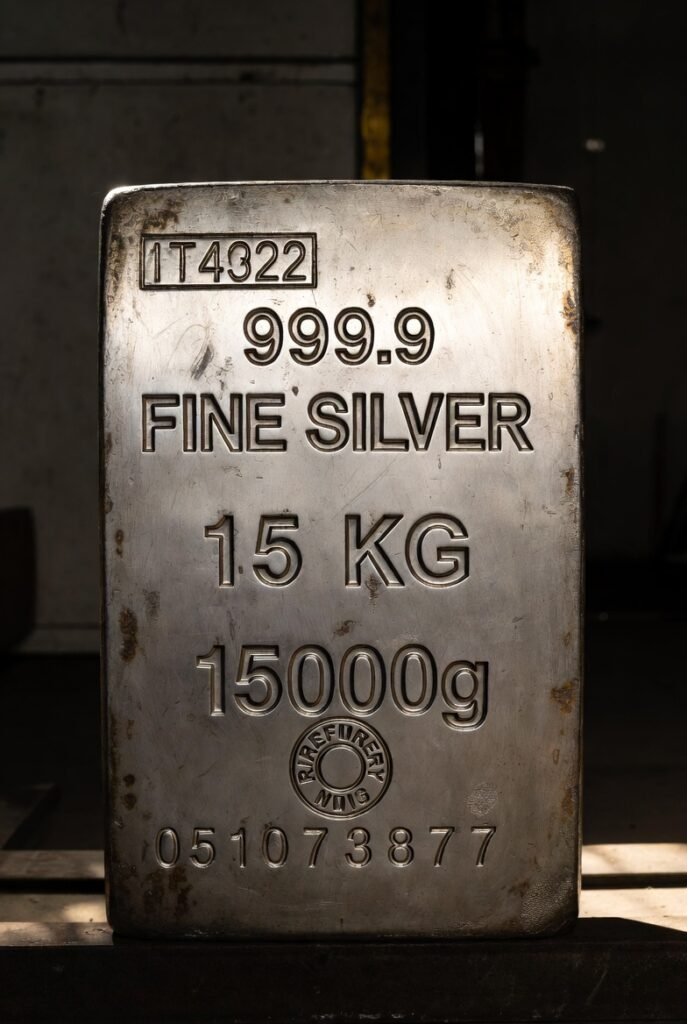
The SGE runs a dedicated benchmark price trading system for silver (contract code: SHAG). This is a twice-daily iterative auction/fixing process designed explicitly for physical silver in standardized 15 kg ingots of at least 99.99% purity. It is not futures trading—trades settle delivery-versus-payment on T+2 (two business days after the trade date). en.sge.com.cn
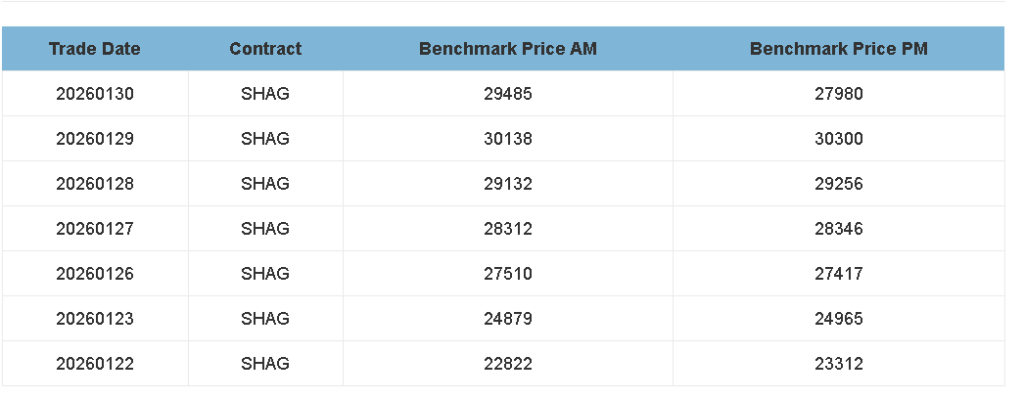
Prices above are in Yuan per kilo. 30,000 Yuan per Kilo is roughly $135 per ounce. (Date on the left shows these prices are from late Jan. 2026)
1 Yuan = $.144679 (about $.15).
1 Kilo = 1000 grams.
31.1 grams = 1 Troy Ounce.
1 Kilo = 32.15 Troy Ounces.
Yuan to USD per Kilo = $4340 / by 1000 grams = $4.34 per gram x 31.1 grams per Troy Ounce = $135.
This process is transparent, electronic, and regulated by the SGE. It forces participants to reveal real buying/selling intent for physical metal, not paper positions. The result—published as separate AM and PM benchmarks—is the price industrial buyers in China reference for large refined silver purchases. en.sge.com.cn
Example Contract Specs (SHAG):
Large buyers (e.g., solar panel makers, electronics firms) or their refiners/suppliers:
Because China accounts for a huge share of global industrial silver consumption, SHAG often trades at a premium to Western benchmarks when physical supply tightens. This premium reflects real metal scarcity—not speculation. Refiners worldwide watch SHAG closely, as arbitrage flows can move physical silver toward the highest-bid market.
For the last 5–7 years, real-world silver demand has consistently outpaced new supply, creating structural deficits year after year. Industrial buyers — especially factories in China and elsewhere — are finding good physical silver harder and harder to secure at “normal” prices. As the Shanghai Gold Exchange’s AM and PM auctions push the SHAG price higher to reflect this growing scarcity, it creates a noticeable disconnect with the slower-moving paper futures prices on COMEX and LBMA.
When that East-West spread widens enough, eastern importers step in: they buy physical silver in the West, absorb the shipping, insurance, and import costs, and deliver it into China for a profit. That flow empties Western vaults and forces the paper markets to catch up. We saw exactly this play out in silver’s recent wild ride — the widening premium lit a fire under speculators, accelerating the surge from $28 to $121.
Eventually, profit-taking and short-term supply relief caused the pullback toward the $60s. But here’s the bigger picture most people miss: the world isn’t slowing its appetite for silver. With fixed mine supply and relentless industrial growth (solar, EVs, AI, electronics), physical availability for factories will keep getting thinner. That means higher SHAG auction prices, bigger spreads, more arbitrage from West to East, and ongoing pressure that drags paper contract prices upward. The physical market isn’t just telling a different story — it’s increasingly writing the main one.
To keep an eye on the Shanghai Gold Exchange (also a silver exchange) visit https://en.sge.com.cn/data_SilverBenchmarkPrice
Converting Yuan Kilo to USD T Oz. :
To read about the thinning physical silver supply: https://silverpundit.com/when-will-the-silver-deficit-deplete-above-ground-stocks/
To read about silver’s limited annual mining limit: https://silverpundit.com/why-silver-supply-lags-behind-soaring-demand/